 9. Drawing graphs
NetworkX is not primarily a graph drawing package but basic drawing with Matplotlib as well as an interface to use the open source Graphviz software package are included. These are part of the networkx.drawing module and will be imported if possible.
First import Matplotlib’s plot interface (pylab works too)
import matplotlib.pyplot as plt
You may find it useful to interactively test code using ipython -pylab, which combines the power of ipython and matplotlib and provides a convenient interactive mode.
To test if the import of networkx.drawing was successful draw G using one of
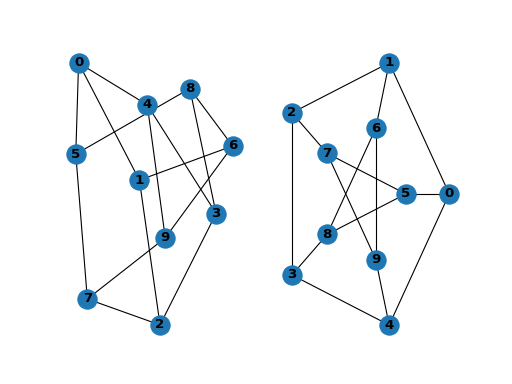
G = nx.petersen_graph()
plt.subplot(121)

nx.draw(G, with_labels=True, font_weight='bold')
plt.subplot(122)

nx.draw_shell(G, nlist=[range(5, 10), range(5)], with_labels=True, font_weight='bold')
2
3
4
5
6
7
(png (opens new window), hires.png (opens new window), pdf (opens new window))
提示
when drawing to an interactive display. Note that you may need to issue a Matplotlib
plt.show()
command if you are not using matplotlib in interactive mode (see Matplotlib FAQ (opens new window) ).
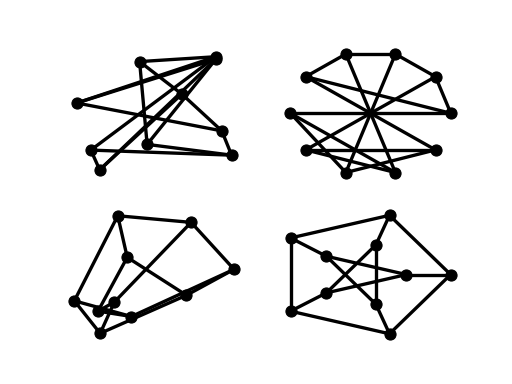
options = {
    'node_color': 'black',
    'node_size': 100,
    'width': 3,
}
plt.subplot(221)

nx.draw_random(G, **options)
plt.subplot(222)

nx.draw_circular(G, **options)
plt.subplot(223)

nx.draw_spectral(G, **options)
plt.subplot(224)

nx.draw_shell(G, nlist=[range(5,10), range(5)], **options)
2
3
4
5
6
7
8
9
10
11
12
13
14
15
16
17
(png (opens new window), hires.png (opens new window), pdf (opens new window))
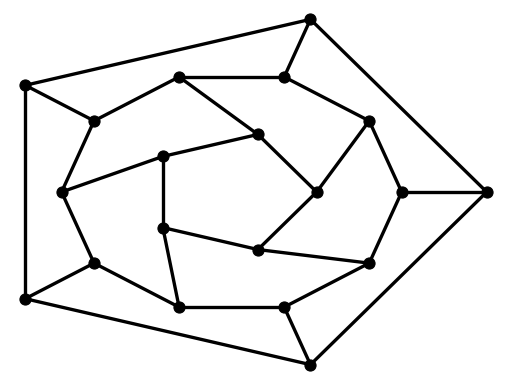
You can find additional options via draw_networkx() (opens new window) and layouts via layout (opens new window). You can use multiple shells with draw_shell() (opens new window).
G = nx.dodecahedral_graph()
shells = [[2, 3, 4, 5, 6], [8, 1, 0, 19, 18, 17, 16, 15, 14, 7], [9, 10, 11, 12, 13]]
nx.draw_shell(G, nlist=shells, **options)
2
3
(png (opens new window), hires.png (opens new window), pdf (opens new window))
To save drawings to a file, use, for example
nx.draw(G)
plt.savefig("path.png")
2
writes to the file path.png in the local directory. If Graphviz and PyGraphviz or pydot, are available on your system, you can also use nx_agraph.graphviz_layout(G) or nx_pydot.graphviz_layout(G) to get the node positions, or write the graph in dot format for further processing.
from networkx.drawing.nx_pydot import write_dot
pos = nx.nx_agraph.graphviz_layout(G)
nx.draw(G, pos=pos)
write_dot(G, 'file.dot')
2
3
4
See Drawing (opens new window) for additional details.